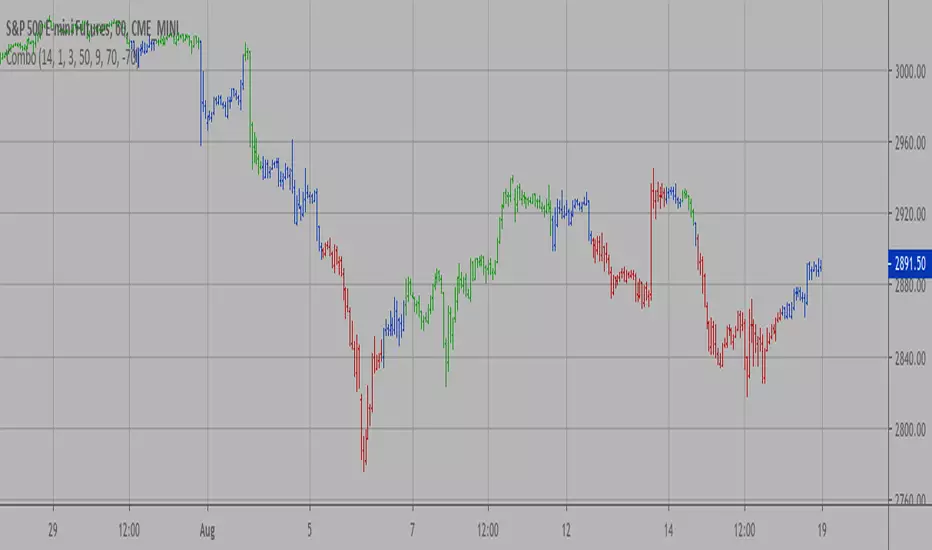
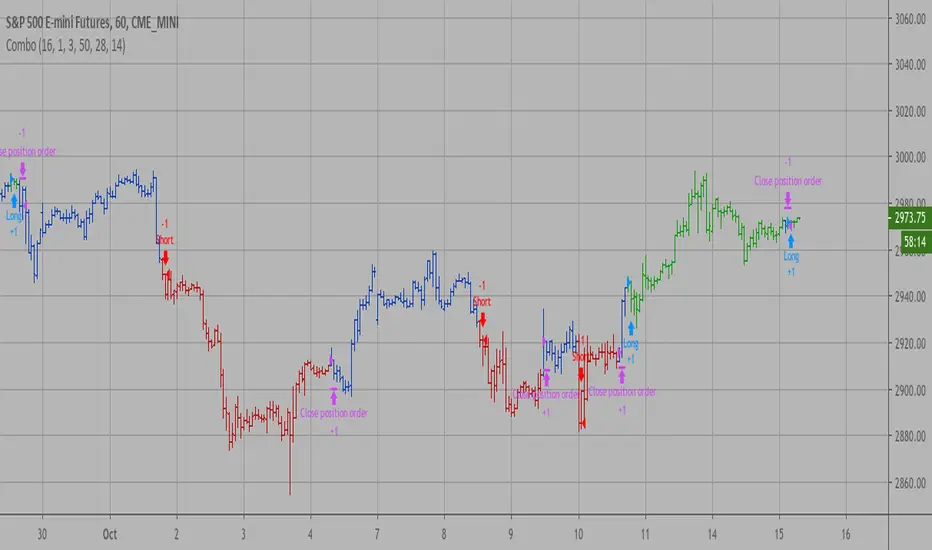
Combo Strategy 123 Reversal & Cueing Off Sup/Res Levels This is combo strategies for get a cumulative signal.
First strategy
This System was created from the Book "How I Tripled My Money In The
Futures Market" by Ulf Jensen, Page 183. This is reverse type of strategies.
The strategy buys at market, if close price is higher than the previous close
during 2 days and the meaning of 9-days Stochastic Slow Oscillator is lower than 50.
The strategy sells at market, if close price is lower than the previous close price
during 2 days and the meaning of 9-days Stochastic Fast Oscillator is higher than 50.
Second strategy
Cueing Off Support And Resistance Levels, by Thom Hartle
modified by HPotter for trade signals.
The related article is copyrighted material from Stocks & Commodities.
WARNING:
- For purpose educate only
- This script to change bars colors.
在腳本中搜尋"the strat"
Combo Backtest 123 Reversal & Confluence This is combo strategies for get a cumulative signal.
First strategy
This System was created from the Book "How I Tripled My Money In The
Futures Market" by Ulf Jensen, Page 183. This is reverse type of strategies.
The strategy buys at market, if close price is higher than the previous close
during 2 days and the meaning of 9-days Stochastic Slow Oscillator is lower than 50.
The strategy sells at market, if close price is lower than the previous close price
during 2 days and the meaning of 9-days Stochastic Fast Oscillator is higher than 50.
Second strategy
This is modified version of Dale Legan's "Confluence" indicator written by Gary Fritz.
================================================================
Here is Gary`s commentary:
Since the Confluence indicator returned several "states" (bull, bear, grey, and zero),
he modified the return value a bit:
-9 to -1 = Bearish
-0.9 to 0.9 = "grey" (and zero)
1 to 9 = Bullish
The "grey" range corresponds to the "grey" values plotted by Dale's indicator, but
they're divided by 10.
WARNING:
- For purpose educate only
- This script to change bars colors.

Combo Strategy 123 Reversal & Confluence This is combo strategies for get a cumulative signal.
First strategy
This System was created from the Book "How I Tripled My Money In The
Futures Market" by Ulf Jensen, Page 183. This is reverse type of strategies.
The strategy buys at market, if close price is higher than the previous close
during 2 days and the meaning of 9-days Stochastic Slow Oscillator is lower than 50.
The strategy sells at market, if close price is lower than the previous close price
during 2 days and the meaning of 9-days Stochastic Fast Oscillator is higher than 50.
Second strategy
This is modified version of Dale Legan's "Confluence" indicator written by Gary Fritz.
================================================================
Here is Gary`s commentary:
Since the Confluence indicator returned several "states" (bull, bear, grey, and zero),
he modified the return value a bit:
-9 to -1 = Bearish
-0.9 to 0.9 = "grey" (and zero)
1 to 9 = Bullish
The "grey" range corresponds to the "grey" values plotted by Dale's indicator, but
they're divided by 10.
WARNING:
- For purpose educate only
- This script to change bars colors.
Combo Backtest 123 Reversal & Comparative Relative Strength This is combo strategies for get a cumulative signal.
First strategy
This System was created from the Book "How I Tripled My Money In The
Futures Market" by Ulf Jensen, Page 183. This is reverse type of strategies.
The strategy buys at market, if close price is higher than the previous close
during 2 days and the meaning of 9-days Stochastic Slow Oscillator is lower than 50.
The strategy sells at market, if close price is lower than the previous close price
during 2 days and the meaning of 9-days Stochastic Fast Oscillator is higher than 50.
Second strategy
Comparative Relative Strength Strategy for ES
WARNING:
- For purpose educate only
- This script to change bars colors.

Combo Strategy 123 Reversal & Comparative Relative Strength This is combo strategies for get a cumulative signal.
First strategy
This System was created from the Book "How I Tripled My Money In The
Futures Market" by Ulf Jensen, Page 183. This is reverse type of strategies.
The strategy buys at market, if close price is higher than the previous close
during 2 days and the meaning of 9-days Stochastic Slow Oscillator is lower than 50.
The strategy sells at market, if close price is lower than the previous close price
during 2 days and the meaning of 9-days Stochastic Fast Oscillator is higher than 50.
Second strategy
Comparative Relative Strength Strategy for ES
WARNING:
- For purpose educate only
- This script to change bars colors.

Combo Strategy 123 Reversal & Commodity Selection Index This is combo strategies for get a cumulative signal.
First strategy
This System was created from the Book "How I Tripled My Money In The
Futures Market" by Ulf Jensen, Page 183. This is reverse type of strategies.
The strategy buys at market, if close price is higher than the previous close
during 2 days and the meaning of 9-days Stochastic Slow Oscillator is lower than 50.
The strategy sells at market, if close price is lower than the previous close price
during 2 days and the meaning of 9-days Stochastic Fast Oscillator is higher than 50.
Second strategy
The Commodity Selection Index ("CSI") is a momentum indicator. It was
developed by Welles Wilder and is presented in his book New Concepts in
Technical Trading Systems. The name of the index reflects its primary purpose.
That is, to help select commodities suitable for short-term trading.
A high CSI rating indicates that the commodity has strong trending and volatility
characteristics. The trending characteristics are brought out by the Directional
Movement factor in the calculation--the volatility characteristic by the Average
True Range factor.
Wilder's approach is to trade commodities with high CSI values (relative to other
commodities). Because these commodities are highly volatile, they have the potential
to make the "most money in the shortest period of time." High CSI values imply
trending characteristics which make it easier to trade the security.
The Commodity Selection Index is designed for short-term traders who can handle
the risks associated with highly volatile markets.
WARNING:
- For purpose educate only
- This script to change bars colors.
Combo Backtest 123 Reversal & EMA & Volume WeightingThis is combo strategies for get a cumulative signal.
First strategy
This System was created from the Book "How I Tripled My Money In The
Futures Market" by Ulf Jensen, Page 183. This is reverse type of strategies.
The strategy buys at market, if close price is higher than the previous close
during 2 days and the meaning of 9-days Stochastic Slow Oscillator is lower than 50.
The strategy sells at market, if close price is lower than the previous close price
during 2 days and the meaning of 9-days Stochastic Fast Oscillator is higher than 50.
Second strategy
The related article is copyrighted material from Stocks & Commodities 2009 Oct
WARNING:
- For purpose educate only
- This script to change bars colors.

Combo Strategy 123 Reversal & EMA & Volume Weighting This is combo strategies for get a cumulative signal.
First strategy
This System was created from the Book "How I Tripled My Money In The
Futures Market" by Ulf Jensen, Page 183. This is reverse type of strategies.
The strategy buys at market, if close price is higher than the previous close
during 2 days and the meaning of 9-days Stochastic Slow Oscillator is lower than 50.
The strategy sells at market, if close price is lower than the previous close price
during 2 days and the meaning of 9-days Stochastic Fast Oscillator is higher than 50.
Second strategy
The related article is copyrighted material from Stocks & Commodities 2009 Oct
WARNING:
- For purpose educate only
- This script to change bars colors.

Combo Backtest 123 Reversal & DMI & Moving Average This is combo strategies for get a cumulative signal.
First strategy
This System was created from the Book "How I Tripled My Money In The
Futures Market" by Ulf Jensen, Page 183. This is reverse type of strategies.
The strategy buys at market, if close price is higher than the previous close
during 2 days and the meaning of 9-days Stochastic Slow Oscillator is lower than 50.
The strategy sells at market, if close price is lower than the previous close price
during 2 days and the meaning of 9-days Stochastic Fast Oscillator is higher than 50.
Second strategy
The related article is copyrighted material from Stocks & Commodities Aug 2009
WARNING:
- For purpose educate only
- This script to change bars colors.
Combo Strategy 123 Reversal & DMI & Moving Average This is combo strategies for get a cumulative signal.
First strategy
This System was created from the Book "How I Tripled My Money In The
Futures Market" by Ulf Jensen, Page 183. This is reverse type of strategies.
The strategy buys at market, if close price is higher than the previous close
during 2 days and the meaning of 9-days Stochastic Slow Oscillator is lower than 50.
The strategy sells at market, if close price is lower than the previous close price
during 2 days and the meaning of 9-days Stochastic Fast Oscillator is higher than 50.
Second strategy
The related article is copyrighted material from Stocks & Commodities Aug 2009
Combining DMI And Moving Average Trading System
WARNING:
- For purpose educate only
- This script to change bars colors.

Combo Backtest 123 Reversal & CMOfilt This is combo strategies for get a cumulative signal.
First strategy
This System was created from the Book "How I Tripled My Money In The
Futures Market" by Ulf Jensen, Page 183. This is reverse type of strategies.
The strategy buys at market, if close price is higher than the previous close
during 2 days and the meaning of 9-days Stochastic Slow Oscillator is lower than 50.
The strategy sells at market, if close price is lower than the previous close price
during 2 days and the meaning of 9-days Stochastic Fast Oscillator is higher than 50.
Second strategy
This indicator plots a CMO which ignores price changes which are less
than a threshold value. CMO was developed by Tushar Chande. A scientist,
an inventor, and a respected trading system developer, Mr. Chande developed
the CMO to capture what he calls "pure momentum". For more definitive
information on the CMO and other indicators we recommend the book The New
Technical Trader by Tushar Chande and Stanley Kroll.
The CMO is closely related to, yet unique from, other momentum oriented
indicators such as Relative Strength Index, Stochastic, Rate-of-Change, etc.
It is most closely related to Welles Wilder`s RSI, yet it differs in several ways:
- It uses data for both up days and down days in the numerator, thereby directly
measuring momentum;
- The calculations are applied on unsmoothed data. Therefore, short-term extreme
movements in price are not hidden. Once calculated, smoothing can be applied to the
CMO, if desired;
- The scale is bounded between +100 and -100, thereby allowing you to clearly see
changes in net momentum using the 0 level. The bounded scale also allows you to
conveniently compare values across different securities.
WARNING:
- For purpose educate only
- This script to change bars colors.

Combo Strategy 123 Reversal & CMOfilt This is combo strategies for get a cumulative signal.
First strategy
This System was created from the Book "How I Tripled My Money In The
Futures Market" by Ulf Jensen, Page 183. This is reverse type of strategies.
The strategy buys at market, if close price is higher than the previous close
during 2 days and the meaning of 9-days Stochastic Slow Oscillator is lower than 50.
The strategy sells at market, if close price is lower than the previous close price
during 2 days and the meaning of 9-days Stochastic Fast Oscillator is higher than 50.
Second strategy
This indicator plots a CMO which ignores price changes which are less
than a threshold value. CMO was developed by Tushar Chande. A scientist,
an inventor, and a respected trading system developer, Mr. Chande developed
the CMO to capture what he calls "pure momentum". For more definitive
information on the CMO and other indicators we recommend the book The New
Technical Trader by Tushar Chande and Stanley Kroll.
The CMO is closely related to, yet unique from, other momentum oriented
indicators such as Relative Strength Index, Stochastic, Rate-of-Change, etc.
It is most closely related to Welles Wilder`s RSI, yet it differs in several ways:
- It uses data for both up days and down days in the numerator, thereby directly
measuring momentum;
- The calculations are applied on unsmoothed data. Therefore, short-term extreme
movements in price are not hidden. Once calculated, smoothing can be applied to the
CMO, if desired;
- The scale is bounded between +100 and -100, thereby allowing you to clearly see
changes in net momentum using the 0 level. The bounded scale also allows you to
conveniently compare values across different securities.
WARNING:
- For purpose educate only
- This script to change bars colors.
Combo Backtest 123 Reversal & CMOav This is combo strategies for get a cumulative signal.
First strategy
This System was created from the Book "How I Tripled My Money In The
Futures Market" by Ulf Jensen, Page 183. This is reverse type of strategies.
The strategy buys at market, if close price is higher than the previous close
during 2 days and the meaning of 9-days Stochastic Slow Oscillator is lower than 50.
The strategy sells at market, if close price is lower than the previous close price
during 2 days and the meaning of 9-days Stochastic Fast Oscillator is higher than 50.
Second strategy
This indicator plots average of three different length CMO's. This indicator
was developed by Tushar Chande. A scientist, an inventor, and a respected
trading system developer, Mr. Chande developed the CMO to capture what he
calls "pure momentum". For more definitive information on the CMO and other
indicators we recommend the book The New Technical Trader by Tushar Chande
and Stanley Kroll.
The CMO is closely related to, yet unique from, other momentum oriented
indicators such as Relative Strength Index, Stochastic, Rate-of-Change, etc.
It is most closely related to Welles Wilder?s RSI, yet it differs in several ways:
- It uses data for both up days and down days in the numerator, thereby directly
measuring momentum;
- The calculations are applied on unsmoothed data. Therefore, short-term extreme
movements in price are not hidden. Once calculated, smoothing can be applied to
the CMO, if desired;
- The scale is bounded between +100 and -100, thereby allowing you to clearly see
changes in net momentum using the 0 level. The bounded scale also allows you to
conveniently compare values across different securities.
WARNING:
- For purpose educate only
- This script to change bars colors.
Combo Strategy 123 Reversal & CMOavThis is combo strategies for get a cumulative signal.
First strategy
This System was created from the Book "How I Tripled My Money In The
Futures Market" by Ulf Jensen, Page 183. This is reverse type of strategies.
The strategy buys at market, if close price is higher than the previous close
during 2 days and the meaning of 9-days Stochastic Slow Oscillator is lower than 50.
The strategy sells at market, if close price is lower than the previous close price
during 2 days and the meaning of 9-days Stochastic Fast Oscillator is higher than 50.
Second strategy
This indicator plots average of three different length CMO's. This indicator
was developed by Tushar Chande. A scientist, an inventor, and a respected
trading system developer, Mr. Chande developed the CMO to capture what he
calls "pure momentum". For more definitive information on the CMO and other
indicators we recommend the book The New Technical Trader by Tushar Chande
and Stanley Kroll.
The CMO is closely related to, yet unique from, other momentum oriented
indicators such as Relative Strength Index, Stochastic, Rate-of-Change, etc.
It is most closely related to Welles Wilder?s RSI, yet it differs in several ways:
- It uses data for both up days and down days in the numerator, thereby directly
measuring momentum;
- The calculations are applied on unsmoothed data. Therefore, short-term extreme
movements in price are not hidden. Once calculated, smoothing can be applied to
the CMO, if desired;
- The scale is bounded between +100 and -100, thereby allowing you to clearly see
changes in net momentum using the 0 level. The bounded scale also allows you to
conveniently compare values across different securities.
WARNING:
- For purpose educate only
- This script to change bars colors.
Combo Backtest 123 Reversal & CMOabsThis is combo strategies for get a cumulative signal.
First strategy
This System was created from the Book "How I Tripled My Money In The
Futures Market" by Ulf Jensen, Page 183. This is reverse type of strategies.
The strategy buys at market, if close price is higher than the previous close
during 2 days and the meaning of 9-days Stochastic Slow Oscillator is lower than 50.
The strategy sells at market, if close price is lower than the previous close price
during 2 days and the meaning of 9-days Stochastic Fast Oscillator is higher than 50.
Second strategy
This indicator plots the absolute value of CMO. CMO was developed by Tushar
Chande. A scientist, an inventor, and a respected trading system developer,
Mr. Chande developed the CMO to capture what he calls "pure momentum". For
more definitive information on the CMO and other indicators we recommend the
book The New Technical Trader by Tushar Chande and Stanley Kroll.
The CMO is closely related to, yet unique from, other momentum oriented indicators
such as Relative Strength Index, Stochastic, Rate-of-Change, etc. It is most closely
related to Welles Wilder`s RSI, yet it differs in several ways:
- It uses data for both up days and down days in the numerator, thereby directly
measuring momentum;
- The calculations are applied on unsmoothed data. Therefore, short-term extreme
movements in price are not hidden. Once calculated, smoothing can be applied to
the CMO, if desired;
- The scale is bounded between +100 and -100, thereby allowing you to clearly see
changes in net momentum using the 0 level. The bounded scale also allows you to
conveniently compare values across different securities.
WARNING:
- For purpose educate only
- This script to change bars colors.

Combo Strategy 123 Reversal & CMOabs This is combo strategies for get a cumulative signal.
First strategy
This System was created from the Book "How I Tripled My Money In The
Futures Market" by Ulf Jensen, Page 183. This is reverse type of strategies.
The strategy buys at market, if close price is higher than the previous close
during 2 days and the meaning of 9-days Stochastic Slow Oscillator is lower than 50.
The strategy sells at market, if close price is lower than the previous close price
during 2 days and the meaning of 9-days Stochastic Fast Oscillator is higher than 50.
Second strategy
This indicator plots the absolute value of CMO. CMO was developed by Tushar
Chande. A scientist, an inventor, and a respected trading system developer,
Mr. Chande developed the CMO to capture what he calls "pure momentum". For
more definitive information on the CMO and other indicators we recommend the
book The New Technical Trader by Tushar Chande and Stanley Kroll.
The CMO is closely related to, yet unique from, other momentum oriented indicators
such as Relative Strength Index, Stochastic, Rate-of-Change, etc. It is most closely
related to Welles Wilder`s RSI, yet it differs in several ways:
- It uses data for both up days and down days in the numerator, thereby directly
measuring momentum;
- The calculations are applied on unsmoothed data. Therefore, short-term extreme
movements in price are not hidden. Once calculated, smoothing can be applied to
the CMO, if desired;
- The scale is bounded between +100 and -100, thereby allowing you to clearly see
changes in net momentum using the 0 level. The bounded scale also allows you to
conveniently compare values across different securities.
WARNING:
- For purpose educate only
- This script to change bars colors.

QuantCat Chande Swinger StrategyQuantCat Chande Swinger
This strategy is designed to be used on the 1 minute with mainly bitcoin, and cryptocurrencies. But parameters can be adjusted to ANY pair.
After some long research about chande momentum oscillator, I decided to create a strategy using normal distribution percentage levels to snipe entries. This in turn on the 1 minute can create a nice profit over a consecutive amount of days, the end goal is to get a stronger version of this strategy running on a bot and print some money. This strategy is tightly defined, and can be loosened up to make more trades too- giving a higher sample size and better sharpe ratio.
The strategy checks to see if the Chande value is in an extreme percentile based on the last few hundred chande values- if it is it will open a position.
No stoploss or take profit implemented into the swinger yet, but this will be the next addition to really minimise loss and amplify potential profits.
Any liquid crypto pair on the low timesframes will net a good result with this strategy.
We also have a free 15M and 1H strategy available too.
You can join our discord server to get live alerts for the strategies as well as speak to our devs! Link in signature below!!!

Combo Backtest 123 Reversal & CMO & WMA This is combo strategies for get a cumulative signal.
First strategy
This System was created from the Book "How I Tripled My Money In The
Futures Market" by Ulf Jensen, Page 183. This is reverse type of strategies.
The strategy buys at market, if close price is higher than the previous close
during 2 days and the meaning of 9-days Stochastic Slow Oscillator is lower than 50.
The strategy sells at market, if close price is lower than the previous close price
during 2 days and the meaning of 9-days Stochastic Fast Oscillator is higher than 50.
Second strategy
This indicator plots Chande Momentum Oscillator and its WMA on the
same chart. This indicator plots the absolute value of CMO.
The CMO is closely related to, yet unique from, other momentum oriented
indicators such as Relative Strength Index, Stochastic, Rate-of-Change,
etc. It is most closely related to Welles Wilder?s RSI, yet it differs
in several ways:
- It uses data for both up days and down days in the numerator, thereby
directly measuring momentum;
- The calculations are applied on unsmoothed data. Therefore, short-term
extreme movements in price are not hidden. Once calculated, smoothing
can be applied to the CMO, if desired;
- The scale is bounded between +100 and -100, thereby allowing you to clearly
see changes in net momentum using the 0 level. The bounded scale also allows
you to conveniently compare values across different securities.
WARNING:
- For purpose educate only
- This script to change bars colors.

Combo Strategy 123 Reversal & CMO & WMA This is combo strategies for get a cumulative signal.
First strategy
This System was created from the Book "How I Tripled My Money In The
Futures Market" by Ulf Jensen, Page 183. This is reverse type of strategies.
The strategy buys at market, if close price is higher than the previous close
during 2 days and the meaning of 9-days Stochastic Slow Oscillator is lower than 50.
The strategy sells at market, if close price is lower than the previous close price
during 2 days and the meaning of 9-days Stochastic Fast Oscillator is higher than 50.
Second strategy
This indicator plots Chandre Momentum Oscillator and its WMA on the
same chart. This indicator plots the absolute value of CMO.
The CMO is closely related to, yet unique from, other momentum oriented
indicators such as Relative Strength Index, Stochastic, Rate-of-Change,
etc. It is most closely related to Welles Wilder?s RSI, yet it differs
in several ways:
- It uses data for both up days and down days in the numerator, thereby
directly measuring momentum;
- The calculations are applied on unsmoothed data. Therefore, short-term
extreme movements in price are not hidden. Once calculated, smoothing
can be applied to the CMO, if desired;
- The scale is bounded between +100 and -100, thereby allowing you to clearly
see changes in net momentum using the 0 level. The bounded scale also allows
you to conveniently compare values across different securities.
How to avoid repainting when using security() - PineCoders FAQNOTE
The non-repainting technique in this publication that relies on bar states is now deprecated, as we have identified inconsistencies that undermine its credibility as a universal solution. The outputs that use the technique are still available for reference in this publication. However, we do not endorse its usage. See this publication for more information about the current best practices for requesting HTF data and why they work.
This indicator shows how to avoid repainting when using the security() function to retrieve information from higher timeframes.
What do we mean by repainting?
Repainting is used to describe three different things, in what we’ve seen in TV members comments on indicators:
1. An indicator showing results that change during the realtime bar, whether the script is using the security() function or not, e.g., a Buy signal that goes on and then off, or a plot that changes values.
2. An indicator that uses future data not yet available on historical bars.
3. An indicator that uses a negative offset= parameter when plotting in order to plot information on past bars.
The repainting types we will be discussing here are the first two types, as the third one is intentional—sometimes even intentionally misleading when unscrupulous script writers want their strategy to look better than it is.
Let’s be clear about one thing: repainting is not caused by a bug ; it is caused by the different context between historical bars and the realtime bar, and script coders or users not taking the necessary precautions to prevent it.
Why should repainting be avoided?
Repainting matters because it affects the behavior of Pine scripts in the realtime bar, where the action happens and counts, because that is when traders (or our systems) take decisions where odds must be in our favor.
Repainting also matters because if you test a strategy on historical bars using only OHLC values, and then run that same code on the realtime bar with more than OHLC information, scripts not properly written or misconfigured alerts will alter the strategy’s behavior. At that point, you will not be running the same strategy you tested, and this invalidates your test results , which were run while not having the additional price information that is available in the realtime bar.
The realtime bar on your charts is only one bar, but it is a very important bar. Coding proper strategies and indicators on TV requires that you understand the variations in script behavior and how information available to the script varies between when the script is running on historical and realtime bars.
How does repainting occur?
Repainting happens because of something all traders instinctively crave: more information. Contrary to trader lure, more information is not always better. In the realtime bar, all TV indicators (a.k.a. studies ) execute every time price changes (i.e. every tick ). TV strategies will also behave the same way if they use the calc_on_every_tick = true parameter in their strategy() declaration statement (the parameter’s default value is false ). Pine coders must decide if they want their code to use the realtime price information as it comes in, or wait for the realtime bar to close before using the same OHLC values for that bar that would be used on historical bars.
Strategy modelers often assume that using realtime price information as it comes in the realtime bar will always improve their results. This is incorrect. More information does not necessarily improve performance because it almost always entails more noise. The extra information may or may not improve results; one cannot know until the code is run in realtime for enough time to provide data that can be analyzed and from which somewhat reliable conclusions can be derived. In any case, as was stated before, it is critical to understand that if your strategy is taking decisions on realtime tick data, you are NOT running the same strategy you tested on historical bars with OHLC values only.
How do we avoid repainting?
It comes down to using reliable information and properly configuring alerts, if you use them. Here are the main considerations:
1. If your code is using security() calls, use the syntax we propose to obtain reliable data from higher timeframes.
2. If your script is a strategy, do not use the calc_on_every_tick = true parameter unless your strategy uses previous bar information to calculate.
3. If your script is a study and is using current timeframe information that is compared to values obtained from a higher timeframe, even if you can rely on reliable higher timeframe information because you are correctly using the security() function, you still need to ensure the realtime bar’s information you use (a cross of current close over a higher timeframe MA, for example) is consistent with your backtest methodology, i.e. that your script calculates on the close of the realtime bar. If your system is using alerts, the simplest solution is to configure alerts to trigger Once Per Bar Close . If you are not using alerts, the best solution is to use information from the preceding bar. When using previous bar information, alerts can be configured to trigger Once Per Bar safely.
What does this indicator do?
It shows results for 9 different ways of using the security() function and illustrates the simplest and most effective way to avoid repainting, i.e. using security() as in the example above. To show the indicator’s lines the most clearly, price on the chart is shown with a black line rather than candlesticks. This indicator also shows how misusing security() produces repainting. All combinations of using a 0 or 1 offset to reference the series used in the security() , as well as all combinations of values for the gaps= and lookahead= parameters are shown.
The close in the call labeled “BEST” means that once security has reached the upper timeframe (1 day in our case), it will fetch the previous day’s value.
The gaps= parameter is not specified as it is off by default and that is what we need. This ensures that the value returned by security() will not contain na values on any of our chart’s bars.
The lookahead security() to use the last available value for the higher timeframe bar we are using (the previous day, in our case). This ensures that security() will return the value at the end of the higher timeframe, even if it has not occurred yet. In our case, this has no negative impact since we are requesting the previous day’s value, with has already closed.
The indicator’s Settings/Inputs allow you to set:
- The higher timeframe security() calls will use
- The source security() calls will use
- If you want identifying labels printed on the lines that have no gaps (the lines containing gaps are plotted using very thick lines that appear as horizontal blocks of one bar in length)
For the lines to be plotted, you need to be on a smaller timeframe than the one used for the security() calls.
Comments in the code explain what’s going on.
Look first. Then leap.

Combo Backtest 123 Reversal & Chande Momentum Oscillator This is combo strategies for get a cumulative signal.
First strategy
This System was created from the Book "How I Tripled My Money In The
Futures Market" by Ulf Jensen, Page 183. This is reverse type of strategies.
The strategy buys at market, if close price is higher than the previous close
during 2 days and the meaning of 9-days Stochastic Slow Oscillator is lower than 50.
The strategy sells at market, if close price is lower than the previous close price
during 2 days and the meaning of 9-days Stochastic Fast Oscillator is higher than 50.
Second strategy
This indicator plots Chande Momentum Oscillator. This indicator was
developed by Tushar Chande. A scientist, an inventor, and a respected
trading system developer, Mr. Chande developed the CMO to capture what
he calls "pure momentum". For more definitive information on the CMO and
other indicators we recommend the book The New Technical Trader by Tushar
Chande and Stanley Kroll.
The CMO is closely related to, yet unique from, other momentum oriented
indicators such as Relative Strength Index, Stochastic, Rate-of-Change,
etc. It is most closely related to Welles Wilder`s RSI, yet it differs
in several ways:
- It uses data for both up days and down days in the numerator, thereby
directly measuring momentum;
- The calculations are applied on unsmoothed data. Therefore, short-term
extreme movements in price are not hidden. Once calculated, smoothing
can be applied to the CMO, if desired;
- The scale is bounded between +100 and -100, thereby allowing you to
clearly see changes in net momentum using the 0 level. The bounded scale
also allows you to conveniently compare values across different securities.
WARNING:
- For purpose educate only
- This script to change bars colors

Combo Strategy 123 Reversal & Chande Momentum OscillatorThis is combo strategies for get a cumulative signal.
First strategy
This System was created from the Book "How I Tripled My Money In The
Futures Market" by Ulf Jensen, Page 183. This is reverse type of strategies.
The strategy buys at market, if close price is higher than the previous close
during 2 days and the meaning of 9-days Stochastic Slow Oscillator is lower than 50.
The strategy sells at market, if close price is lower than the previous close price
during 2 days and the meaning of 9-days Stochastic Fast Oscillator is higher than 50.
Second strategy
This indicator plots Chande Momentum Oscillator. This indicator was
developed by Tushar Chande. A scientist, an inventor, and a respected
trading system developer, Mr. Chande developed the CMO to capture what
he calls "pure momentum". For more definitive information on the CMO and
other indicators we recommend the book The New Technical Trader by Tushar
Chande and Stanley Kroll.
The CMO is closely related to, yet unique from, other momentum oriented
indicators such as Relative Strength Index, Stochastic, Rate-of-Change,
etc. It is most closely related to Welles Wilder`s RSI, yet it differs
in several ways:
- It uses data for both up days and down days in the numerator, thereby
directly measuring momentum;
- The calculations are applied on unsmoothed data. Therefore, short-term
extreme movements in price are not hidden. Once calculated, smoothing
can be applied to the CMO, if desired;
- The scale is bounded between +100 and -100, thereby allowing you to
clearly see changes in net momentum using the 0 level. The bounded scale
also allows you to conveniently compare values across different securities.
WARNING:
- For purpose educate only
- This script to change bars colors.